Unlike most trading indicators, volume is not a derivative of price. Volume can be analyzed along with price in order to help determine the state of a given market. However, like price, Volume data can be difficult to analyze without the proper knowledge. Our NinjaTrader Volume Indicator provides a color coded visual representation of the volume data, making it easy to analyze and react to changes in volume.
Volume Indicator Trading States:
When analyzing the Volume Indicator, there are four possible market states. The state of the current market can provide valuable insight and help determine which way the market is going. The four possible states are:
| Market State | Expected Behavior |
|---|---|
| Buyers Controlling the Market | Market Expansion |
| Buy Move Exhaustion | Market Contraction |
| Sellers Controlling Market | Market Expansion |
| Sell Move Exhaustion | Market Contraction |

Trading with the NinjaTrader Volume Indicator:
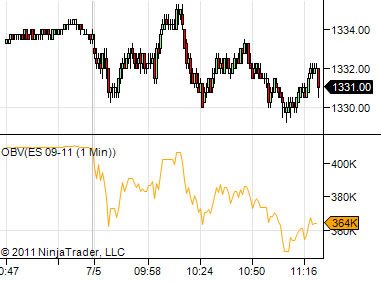
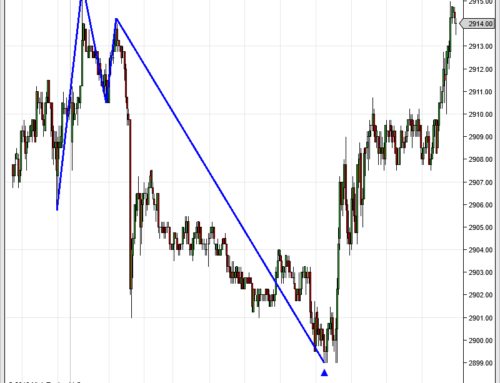
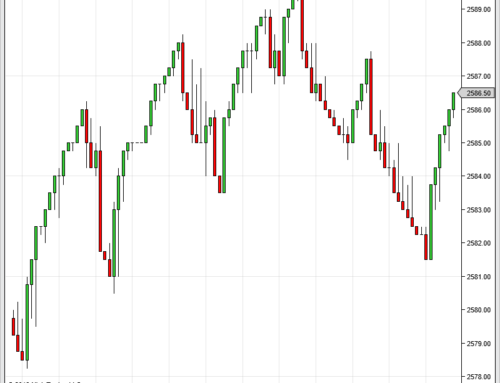
To avoid the chop in the market, we look for 2 consecutive bars of a given color to confirm the market state. The light colored bars (light green and pink) indicate states of market expansion, or trend continuations. The dark colored bars (dark green and dark red) indicate states of market contraction, or pullbacks. In general, we want to enter trades during a period of contraction (after a pullback), so we can participate in the profits from the trend expansion/continuation. As you can see from the screen shot above, the Volume Indicator is very good at identifying key exhaustion and contraction points in the market.
Purchase a Lifetime License
Only $99.95
Click the Buy Now button to purchase a lifetime license for our NinjaTrader Volume Indicator. Licensing includes lifetime support and upgrades.
Leave A Comment